Coding tools like Claude Code promise to attach jetpacks to developers, and the data backs it up. With , teams are seeing real productivity gains that go far beyond simple code completion and that models can automate…

Coding tools like Claude Code promise to attach jetpacks to developers, and the data backs it up. With 79% of Claude Code conversations being automation tasks, teams are seeing real productivity gains that go far beyond simple code completion and that models can automate more than augment as they get better. During the June 12th cloud outage, I realized how dependent I'd become on Claude Code - even for fixing simple apostrophe errors in convoluted cURL commands.
Your team probably already understands the need for developer productivity tools, and with Claude Code accessing the Anthropic API directly (directly or through cloud providers), key security concerns have been quelled. What you need now is telemetry to answer the important questions: Are developers actually using it? Which teams are getting the most value? What's our real cost per feature or bug fix?
This guide walks you through setting up observability with Claude Code using OpenTelemetry metrics. You'll get the complete setup - from Prometheus configuration to automated reporting - so your engineering leadership can make data-driven decisions about your AI tooling investment.
Before diving into Prometheus, let's verify telemetry is working:
1export CLAUDE_CODE_ENABLE_TELEMETRY=12export OTEL_METRICS_EXPORTER=console3export OTEL_METRIC_EXPORT_INTERVAL=10004claude -p "hello world"
You should see output like this:
1=== Resource Attributes ===2{ 'service.name': 'claude-code', 'service.version': '1.0.17' }3===========================45{6 descriptor: {7 name: 'claude_code.cost.usage',8 type: 'COUNTER',9 description: 'Cost of the Claude Code session',10 unit: 'USD',11 valueType: 112 },13 dataPointType: 3,14 dataPoints: [15 {16 attributes: {17 'user.id': '7b673f5715f2da49af2cdd341e0cad17fb3274f32d4ceed00d57d53da4e76fb2',18 'session.id': '092d99fc-ac17-4ee7-b310-57d387777c91',19 'model': 'claude-4-sonnet-20250514'20 },21 value: 0.00029722 }23 ]24}
For actual ROI measurement, you need Prometheus. Console output is just debugging - Prometheus gives you dashboards, historical data, and executive-ready visualizations.
First, grab the configuration files:
1# Clone the configuration repo2git clone https://github.com/katchu11/claude-code-guide3docker-compose up -d
Configure Claude Code to send metrics to Prometheus:
1# Enable telemetry2export CLAUDE_CODE_ENABLE_TELEMETRY=134# Configure OTLP exporter5export OTEL_METRICS_EXPORTER=otlp6export OTEL_EXPORTER_OTLP_PROTOCOL=grpc7export OTEL_EXPORTER_OTLP_ENDPOINT=http://localhost:431789# Optional: Set authentication if required10# export OTEL_EXPORTER_OTLP_HEADERS="Authorization=Bearer your-token"1112# Run Claude Code13claude
Common infrastructure endpoints:
Once data is flowing, these queries give you the insights you need:
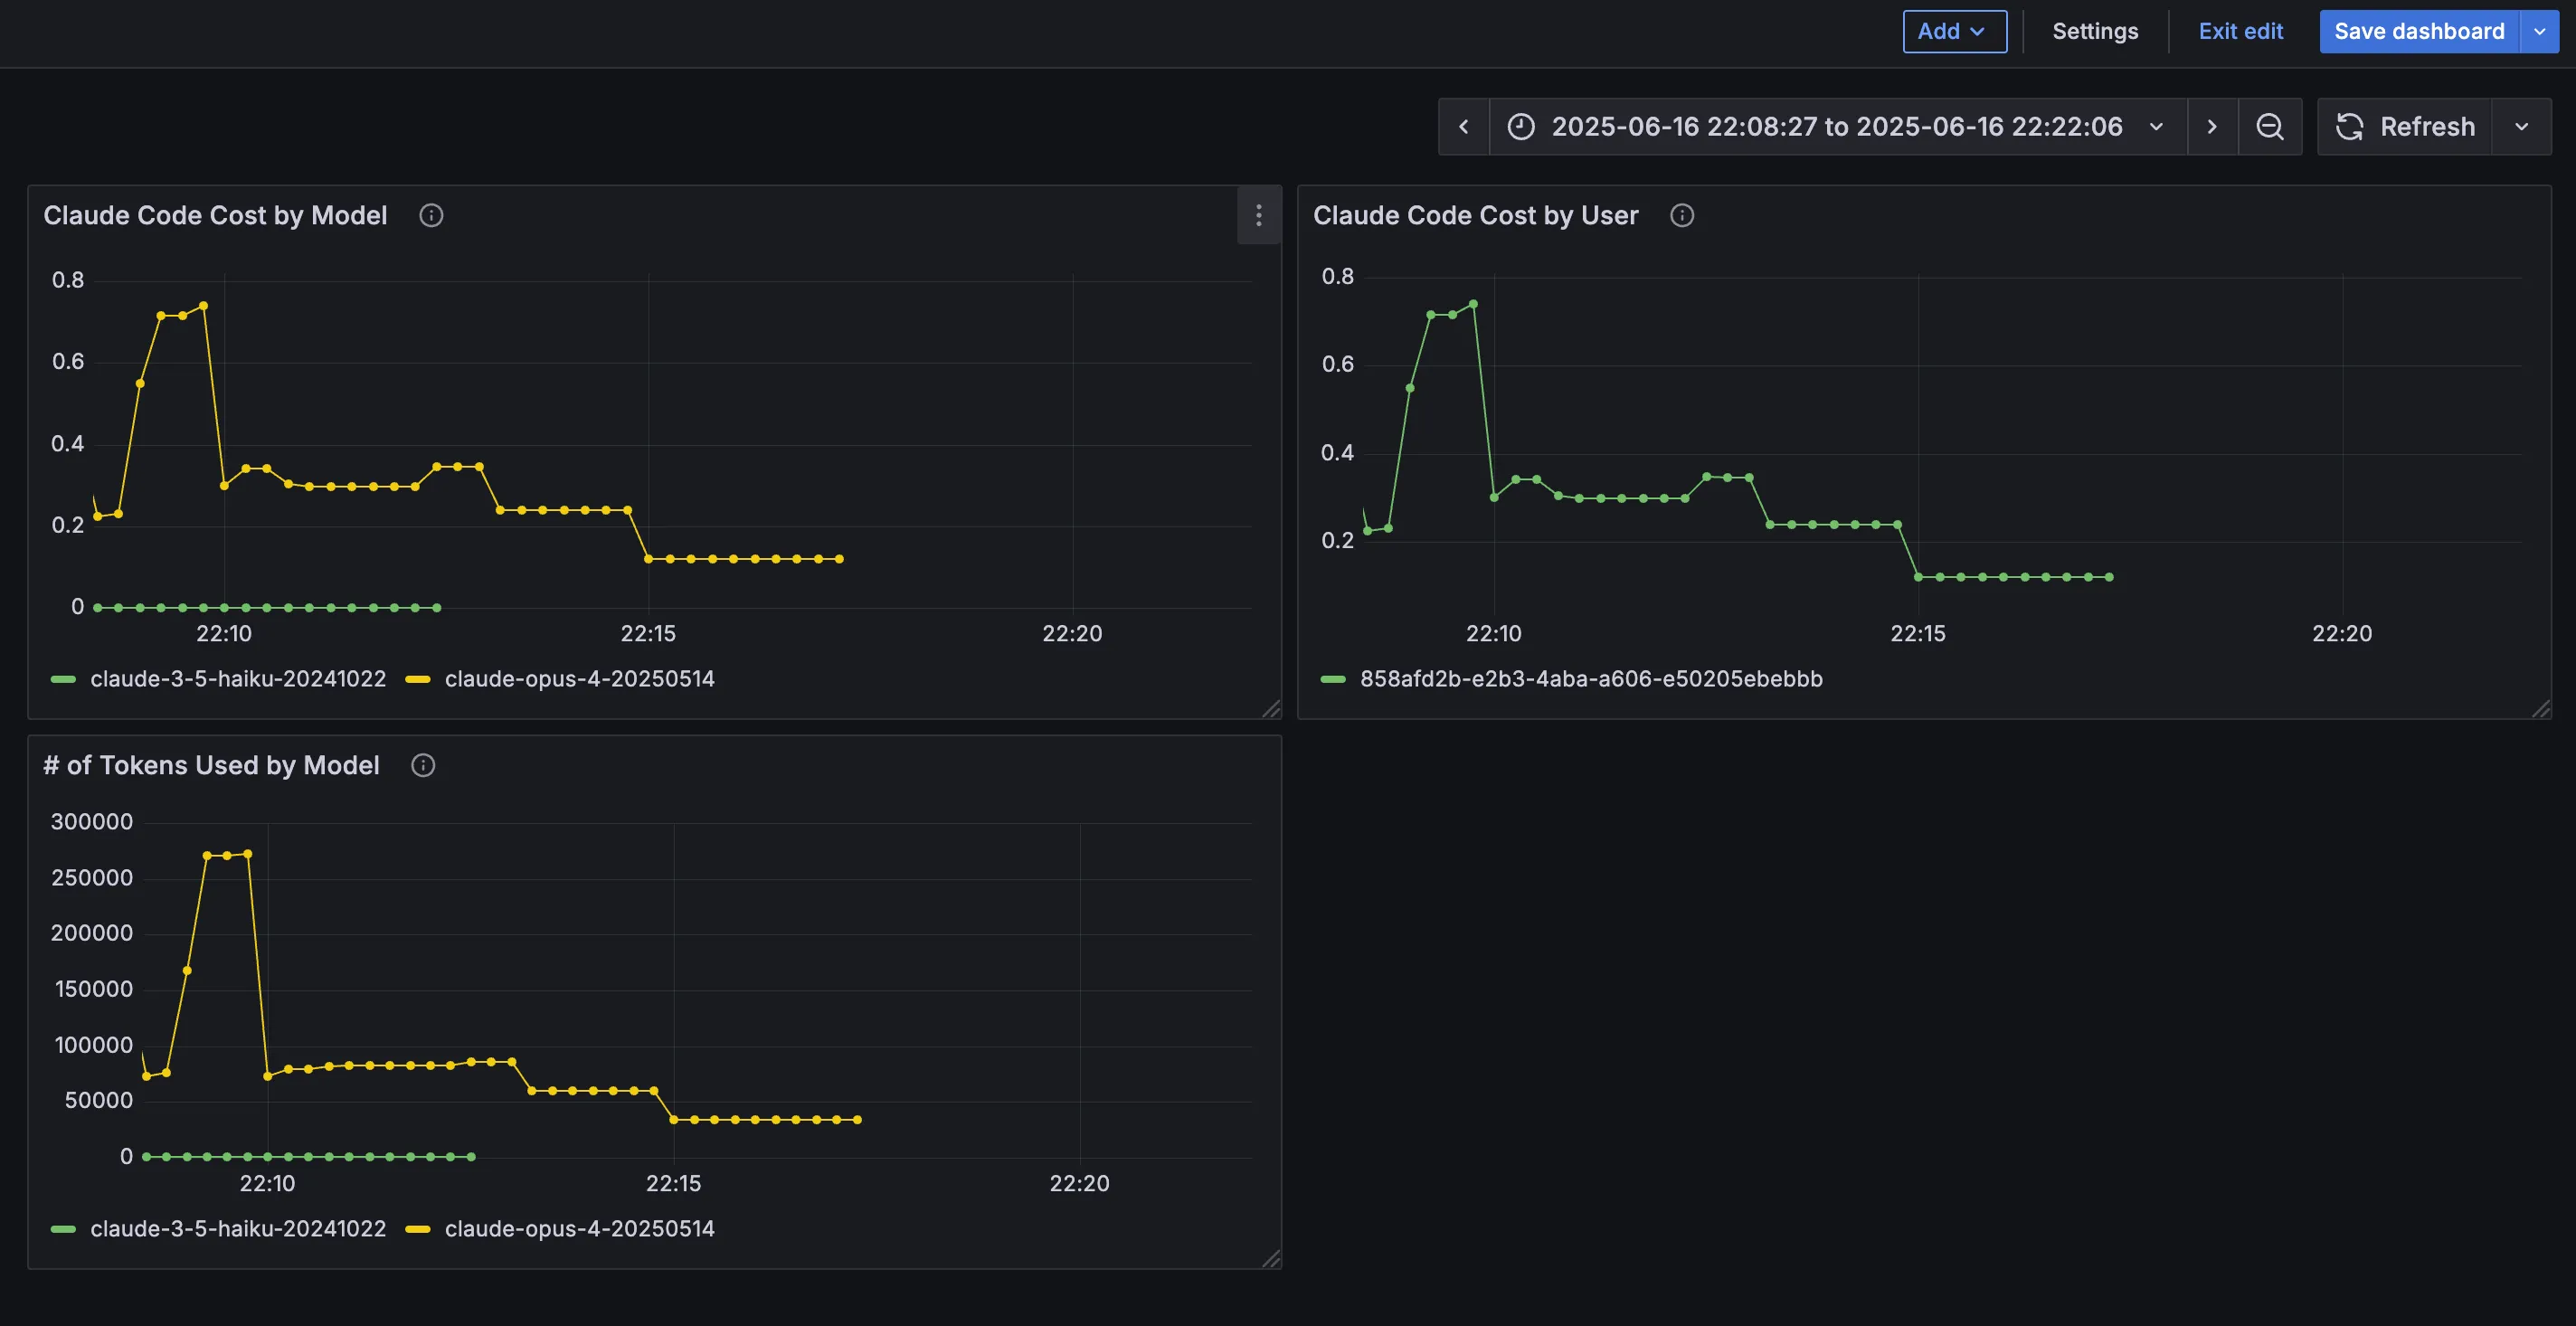
1# Total cost across all sessions2sum(claude_code_cost_usage_USD_total)3{} 0.4345# Token usage by type (input/output)6sum(claude_code_token_usage_tokens_total) by (type)7{type="input"} 7518{type="output"} 18639{type="cacheCreation"} 213610{type="cacheRead"} 784651112# Token usage by user email13sum(claude_code_token_usage_tokens_total) by (user_email)14{user_email="user@company.com"} 832151516# Cost by model type17sum(claude_code_cost_usage_USD_total) by (model)18{model="claude-opus-4-20250514"} 0.42919{model="claude-3-5-haiku-20241022"} 0.00062021# Rate of token consumption over time (requires multiple data points)22rate(claude_code_token_usage_tokens_total[5m])23{type="input"} 2.524{type="output"} 6.225{type="cacheRead"} 261.5
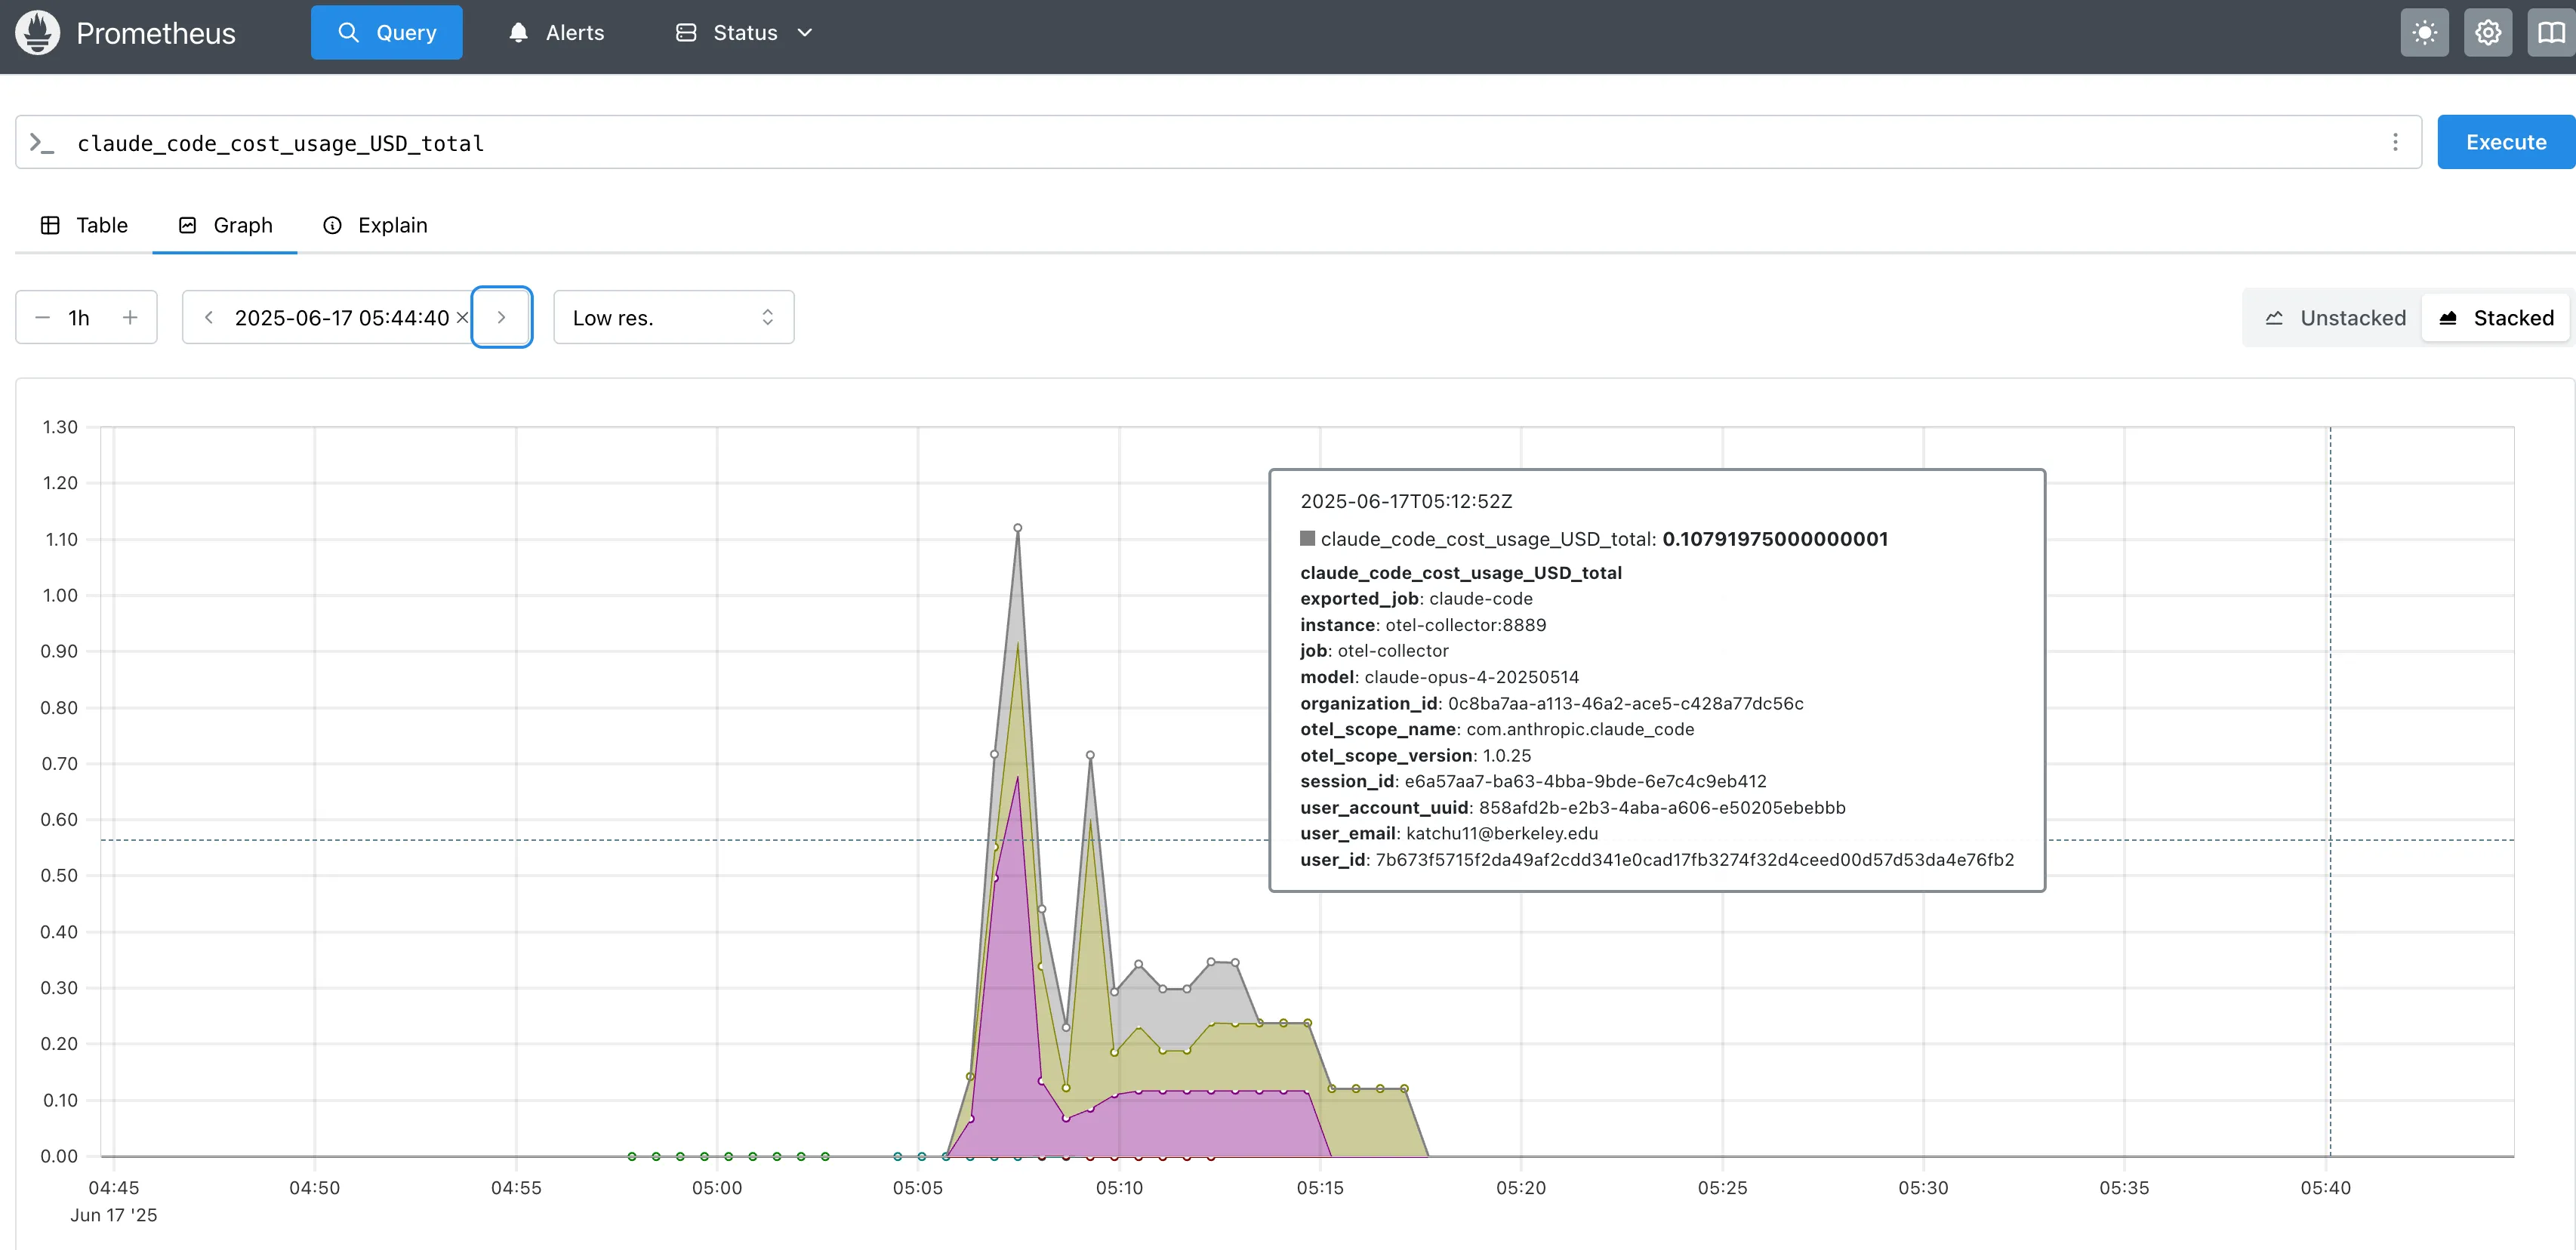
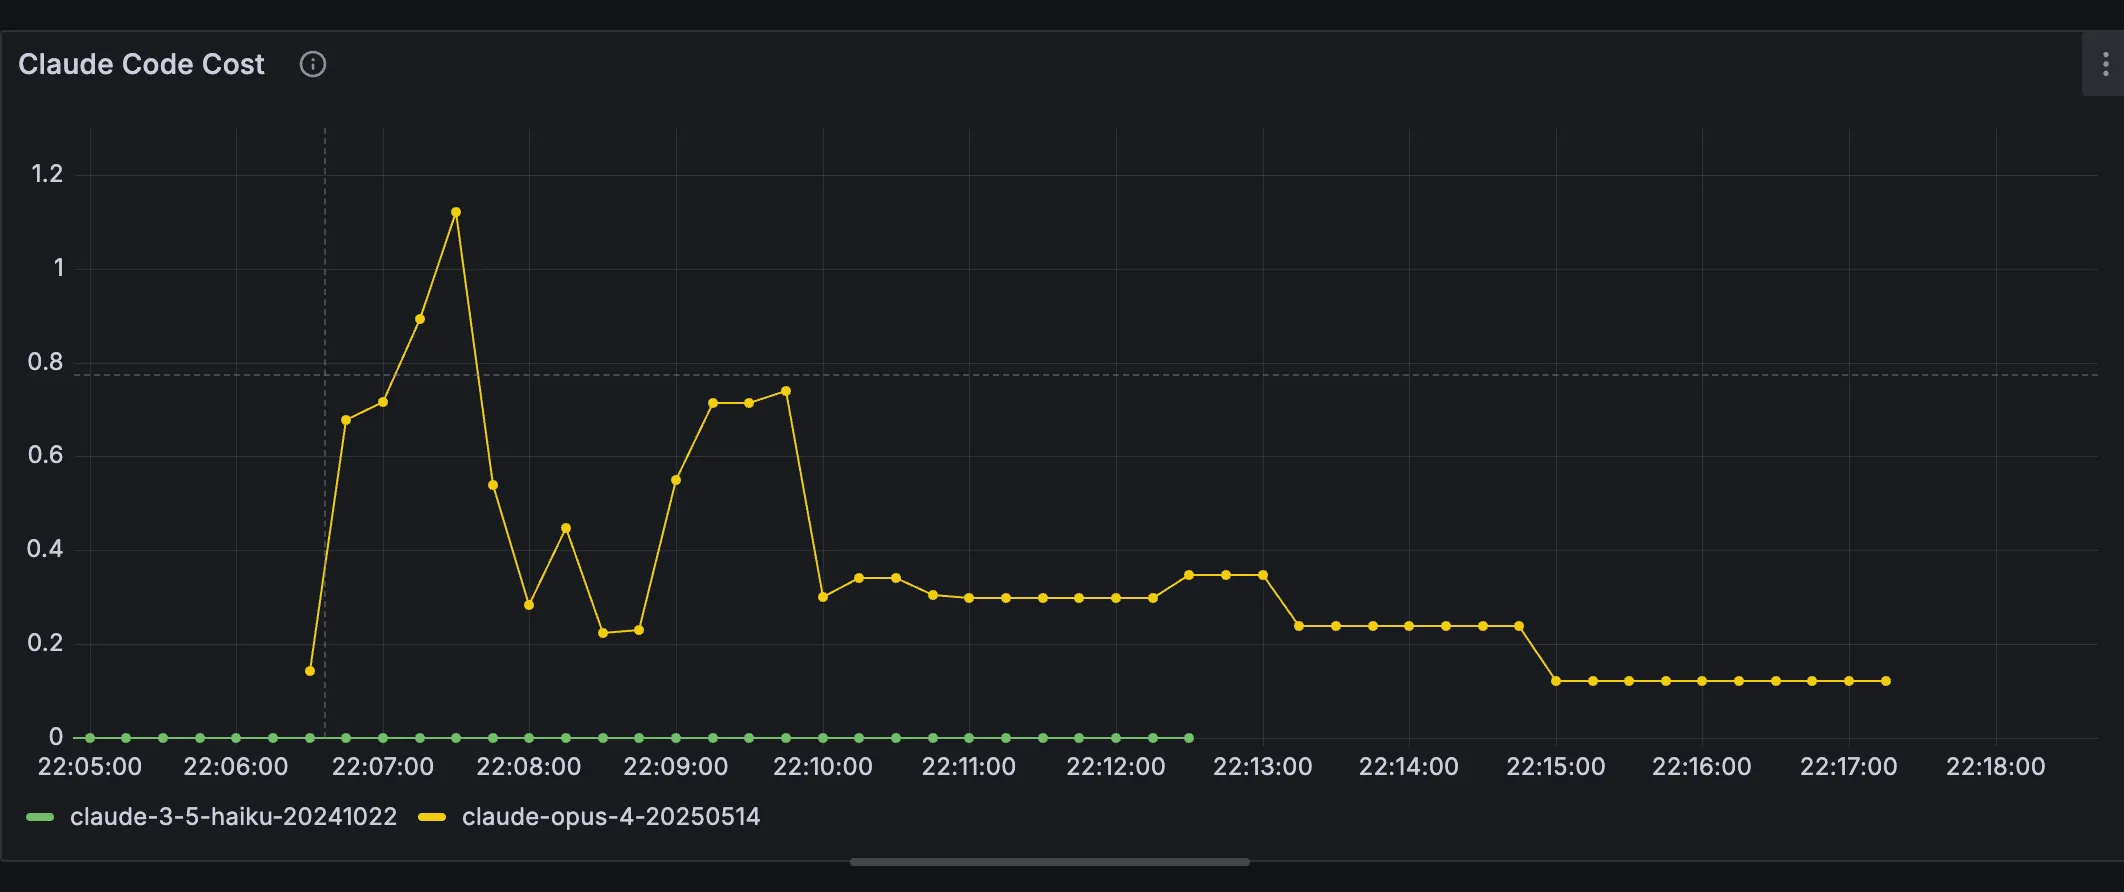
Let's start with what Claude Code actually costs. Unlike fixed subscription tools, Claude Code has variable costs based on usage patterns.
The claude_code.token.usage metric breaks down by:
Usage Patterns by Plan Type:
Subscription Users (Pro/Max):
API Users (Pay-per-token) - Real Usage Patterns:
Pro tip: "ultrathink" triggers Claude's maximum thinking budget for complex analysis. The hierarchy is: "think" < "think hard" < "think harder" < "ultrathink" - each level increases the amount of tokens set to the reasoning budget. See Claude Code's best practices doc for more info!
Simple Development Tasks (Haiku):
Real examples: Complex architectural analysis cost $0.34, simple "hello world" cost $0.0003
*Annual discounts may be available for subscription plans.
API Pricing by Model:
Pro tip: For regular Claude Code usage, Max subscriptions are often more predictable than API costs. Individual developers can't control API optimizations like prompt caching, making subscriptions simpler for daily development work.
Note: Telemetry may require a clean Claude Code installation if you experience hanging. See troubleshooting.md for solutions.
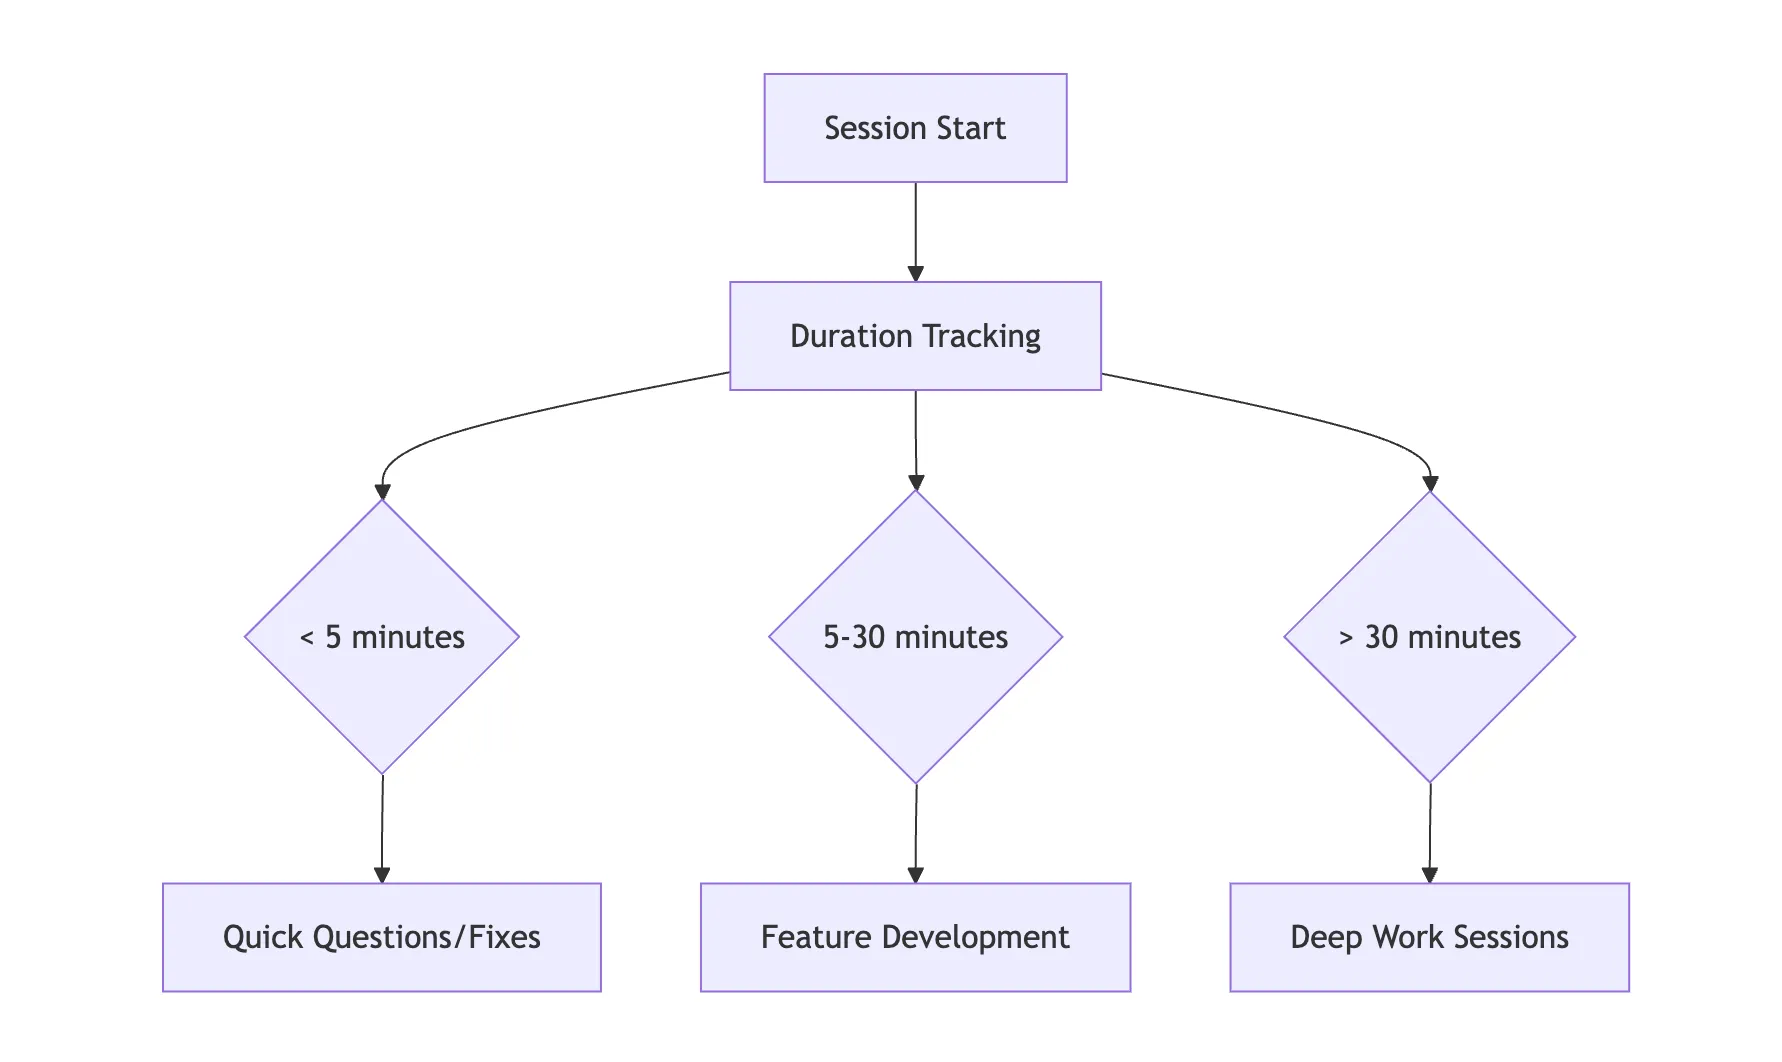
Understanding how long developers stay in Claude Code sessions helps identify engagement patterns:
Measuring developer productivity isn't straightforward, but Claude Code provides several useful metrics for tracking impact on your development workflows.
Claude Code provides these additional telemetry metrics:
While Claude Code provides specific telemetry, you can combine this with your existing development metrics:
Key insight: The built-in metrics work best when combined with your existing Git and project management data.
Based on Anthropic's research on software development impact:
Important Note: The metrics and examples in this guide are generated from limited sample data and hypothetical scenarios. Development workflows vary significantly across:
Your organization should define what productivity means in your context. Claude Code provides the measurement tools - the interpretation depends on your team's goals and workflows.
Here are a few common questions and how to answer them. These examples demonstrate the insights you can extract from Claude Code telemetry specific to your organization:
Question 1: What's our ROI on Claude Code per developer?
1// Calculate cost-to-value ratio2developerId = user.account_uuid3totalCost = sum(claude_code.cost.usage) by (developerId)4prCount = sum(claude_code.pull_request.count) by (developerId)5commitCount = sum(claude_code.commit.count) by (developerId)6linesAdded = sum(claude_code.lines_of_code.count{type="added"}) by (developerId)7avgCostPerCommit = totalCost / commitCount8avgCostPerLine = totalCost / linesAdded
Question 2: How does developer tenure correlate with effective Claude Code usage?
1// Assuming you have developer tenure data available in your analytics platform2// Calculate tool acceptance rates per developer3acceptanceRates = sum(claude_code.code_edit_tool.decision{decision="accept"}) by (developerId) /4 count(claude_code.code_edit_tool.decision) by (developerId)56// Correlate with developer experience data7// Experience categories: junior, mid, senior8correlate(developerExperienceCategory, acceptanceRates)910// Track progression over onboarding timeline11timeSeriesAnalysis(acceptanceRates, timeWindow=90d, groupBy=experienceLevel)
Question 3: Should we switch to subscription plans instead of pay-as-you-go?
1// Calculate total cost under current pay-as-you-go model2currentMonthlyCost = sum(claude_code.cost.usage) over last_30d34// Project costs for different subscription tiers5// Claude Pro: $20/mo per user with 1x capacity6// Claude Max 5x: $100/mo per user with 5x capacity7// Claude Max 20x: $200/mo per user with 20x capacity8activeUsers = count(distinct user.account_uuid) where claude_code.session.count > 09proTierCost = activeUsers * 2010maxTier5xCost = activeUsers * 10011maxTier20xCost = activeUsers * 2001213// Analyze typical usage patterns to determine capacity needs14avgTokensPerUserPerMonth = sum(claude_code.token.usage) by (user.account_uuid) / activeUsers15// Determine if users would hit subscription limits based on usage patterns16usersExceedingProTier = count(users where avgTokensPerUserPerMonth > proTierLimit)1718// Calculate projected cost savings or additional expense19subscriptionSavings = currentMonthlyCost - recommendedTierCost
Question 4: Where are our developers getting stuck with Claude Code?
1// Detect problematic usage patterns2problemPatterns = {3 // Long sessions with no commits4 longUnproductiveSessions = filter(5 duration > 30min AND claude_code.commit.count == 0,6 group by (developerId, sessionId)7 ),8 // High rejection rates9 toolRejectionHotspots = filter(10 claude_code.code_edit_tool.decision{decision="reject"} > 10,11 group by (developerId, tool)12 ),13 // API errors14 apiErrorPatterns = group by (error, model) {15 count(claude_code.api_error)16 }17}
Question 5: How does Claude Code impact our MTTR for bug fixes?
1// Join bug resolution data with Claude Code usage2bugData = loadFromJira("bugs_resolved.csv")3claudeUsageForBugs = filter(4 claude_code.user_prompt contains "bug" OR5 claude_code.user_prompt contains "fix" OR6 claude_code.session metadata.issue_id in bugData.issueIds,7 group by (developerId, issue_id)8)9// Calculate MTTR with and without Claude assistance10mttrWithClaude = avg(bugData.resolutionTime where bugData.issueId in claudeUsageForBugs.issue_id)11mttrWithoutClaude = avg(bugData.resolutionTime where bugData.issueId not in claudeUsageForBugs.issue_id)12improvementRatio = mttrWithoutClaude / mttrWithClaude
Claude Haiku can effectively analyze your telemetry data, particularly user prompts. Here's a technical implementation approach:
1// Extract user prompt data from OpenTelemetry logs2// Note: requires setting OTEL_LOG_USER_PROMPTS=1 to capture actual prompt content3userPromptEvents = query {4 from: claude_code.user_prompt5 select: [user.account_uuid, prompt, prompt_length, event.timestamp]6 where: event.timestamp >= now() - 30d7}89// Process batches of prompts through Claude Haiku10function analyzePromptPatterns(prompts) {11 // Structure the analysis request12 const request = {13 model: "claude-3-5-haiku-20241022",14 messages: [{15 role: "user",16 content: `Analyze these developer prompts and identify:17 1. Common task categories (debugging, feature development, refactoring, etc.)18 2. Prompt quality patterns (specificity, context provided, clarity)19 3. Developer skill indicators in the prompts20 4. Recommended prompt improvements for better results21 5. Areas where developers need additional training2223 Prompts to analyze:24 ${JSON.stringify(prompts)}2526 Format your response as structured JSON with the categories above.`27 }]28 };2930 // Process through Haiku (low-cost analysis)31 return callClaudeAPI(request);32}3334// Categorize developers by usage patterns35developerSegments = analyzePromptPatterns(userPromptEvents)36 .groupBy(user.account_uuid)37 .calculateMetrics([38 "avgPromptQuality",39 "dominantTaskCategory",40 "skillLevel",41 "improvementAreas"42 ]);4344// Generate customized training recommendations45trainingRecommendations = developerSegments46 .filter(segment => segment.improvementAreas.length > 0)47 .map(segment => ({48 userId: segment.user.account_uuid,49 recommendations: segment.improvementAreas.map(area => trainingModules[area])50 }));
This approach lets you cost-effectively analyze thousands of prompts using Haiku's lower pricing while extracting valuable insights to improve developer effectiveness.
Real-world telemetry snapshot:
Your actual usage patterns will depend on:
Use this telemetry data as input for your organization's specific value assessment framework.
Here's where it gets fun. You can ask Claude to generate reports combining your telemetry data with project management metrics.
Claude Code has built-in MCP support. Set up the Linear MCP server using the CLI:
1# Add Linear MCP server to Claude Code2claude mcp add linear -s user -- npx -y mcp-remote https://mcp.linear.app/sse34# Verify it's working5claude mcp list67# Restart Claude Code to activate the integration8Alternatively, you can configure it directly in your .claude.json file:9{10 "mcpServers": {11 "linear": {12 "type": "stdio",13 "command": "npx",14 "args": ["-y", "mcp-remote", "https://mcp.linear.app/sse"]15 }16 }17}
We've created a comprehensive prompt template for generating reports. Here's a simplified example:
1claude -p "Using the Linear MCP, analyze our team's velocity for the last sprint and combine with these Claude Code metrics:23{4 \"claude_code_sessions\": 42,5 \"total_cost\": 103.45,6 \"avg_session_duration\": \"28.5 minutes\",7 \"tool_acceptance_rates\": {\"Edit\": 0.81, \"MultiEdit\": 0.92}8}910Generate a comprehensive productivity report with visualizations."
Dynamic Metric Fetching Example:
1#!/bin/bash2# fetch-claude-metrics.sh - Automate report generation with live data34# Fetch metrics from Prometheus5TOTAL_COST=$(curl -s "http://localhost:9090/api/v1/query?query=sum(claude_code_cost_usage_USD_total)" | jq -r '.data.result[0].value[1] // "0"')6INPUT_TOKENS=$(curl -s "http://localhost:9090/api/v1/query?query=sum(claude_code_token_usage_tokens_total{type=\"input\"})" | jq -r '.data.result[0].value[1] // "0"')7OUTPUT_TOKENS=$(curl -s "http://localhost:9090/api/v1/query?query=sum(claude_code_token_usage_tokens_total{type=\"output\"})" | jq -r '.data.result[0].value[1] // "0"')89# Generate report with live data10claude -p "Using the Linear MCP, analyze our team's velocity and combine with these live Claude Code metrics:1112{13 \"total_cost\": $TOTAL_COST,14 \"input_tokens\": $INPUT_TOKENS,15 \"output_tokens\": $OUTPUT_TOKENS,16 \"cost_per_token\": $(echo "$TOTAL_COST / ($INPUT_TOKENS + $OUTPUT_TOKENS)" | bc -l)17}1819Generate a comprehensive productivity report with visualizations."
For the complete prompt with all metrics and detailed instructions, see report-generation-prompt.md.
Using the prompt template above, Claude generates comprehensive reports like this:
Executive Summary
This week's analysis shows a 17% improvement in commit velocity for teams using Claude Code effectively. Total cost was $103.45 across 15 active Linear issues.
Key Insights Generated
What the Report Includes:
For the complete generated report with all visualizations and metrics, see sample-report-output.md.
Rolling out telemetry across your organization is straightforward with managed settings.
Create a managed-settings.json file:
1{2 "telemetry": {3 "enabled": true,4 "endpoint": "https://your-otel-collector.company.com:4317",5 "headers": {6 "Authorization": "Bearer ${OTEL_TOKEN}"7 }8 },9 "exporters": {10 "metrics": "otlp",11 "logs": "otlp"12 }13}
Deploy via your MDM solution or configuration management tool. Users can't disable telemetry, ensuring consistent data collection.
For detailed deployment options, see the Claude Code deployment documentation.
Measuring Claude Code's ROI doesn't have to be complicated. The key steps are:
